Facebook Blogging
Edward Hugh has a lively and enjoyable Facebook community where he publishes frequent breaking news economics links and short updates. If you would like to receive these updates on a regular basis and join the debate please invite Edward as a friend by clicking the Facebook link at the top of the right sidebar.
Monday, March 31, 2008
Latvia Retail Sales February 2008
As in the case of Estonia, retail sales in Latvia experienced something of a rebound in February, with an increase in sales after two consective months of contraction (seasonally corrected figures), according to data out today from Latvijas Statistika. On a year on year basis sales were up by 1 percent in February, following a year on year contraction of 0.7% in January. Compared to the combined months of January – February 2007, in January and February combined retail trade turnover increased by 0.2%. I think here we should be thankful for small mercies, since the situation has consolidated rather, and not deteriorated further. However the increase was rather more moderate than the 4% year on year increase which took place in Estonia.
Apart from the general point which I made in the case of Estonia that, apart from noting the fact, we really need to wait a few more months to see where all this is leading before trying to draw any lasting conclusions, I also think that it is worth bearing in mind, as in the case of Estonia, that real wages (derived by subtracting the monthly rate of inflation from the rise in money wages) were still rising at an annual rate of 11.1% back in December (which is the last month for which we have data at this point), although as can be seen in the chart the rate of increase is decelerating rapidly (although again this is as much a by-product of the rapid acceleration in Latvian inflation as it is of anything else, since money wages were still rising at a 25.2% annual rate in December). So when we come to think about retail sales we should remember that for the time being people continue to have more money in their pockets, although as inflation comes under control this situation is almost certainly not going to last, and when it doesn't then that is when I think we will see the real impact on retail sales.
Wednesday, March 26, 2008
Latvia Producer Prices February 2008
Producer prices in Latvian industry rose by 1.7% month on month in February, according to data from the Latvian Central Statistical Bureau. Year on year producer prices increased by 11.4% over February 2007. On the monthly basis, the biggest increase was in tariffs for electricity, gas, steam and hot water supply (by 0.6 percentage points). The rise in prices for the manufacture of basic metals increased the overall level of producer prices by 0.5 percentage points, while the manufacture of food products and beverages was responsible for 0.4 percentage points. However, there was a decrease (by 0.3 percentage points) in the price of manufacture of wood and wood products (except furniture).
In annual terms the manufacture of food products and beverages made the biggest impact on the overall level of producer prices, increasing by 4.7 percentage points. The increase of the tariffs of electricity, gas, steam and hot water supply raised the overall price level by 1.7 percentage points.
Prices in the export sector were up 5.7% year on year, and 1.5% month on month. This last detail is important, because it should be noted in the chart above that both total producer prices and prices in the export sector alone have both - hopefully only temporarily - ceased their downward march in terms of year on year rates of increase. Like this it will be hard to sustain export competitiveness.
Monday, March 10, 2008
Latvia Inflation February 2008
Latvian inflation accelerated to a 16.7 per cent annual rate in February, up from 15.8 per cent in January, Latvijas Statistika said today. Compared to January 2008, the average consumer price level in February 2008 rose by 1.3%. Prices for goods increased by 1.5%, and prices for services rose by 0.9%.
The rise in the prices of tobacco products, heating energy, as well as services related to the housing maintenance and the price decrease of telecommunication services had the greatest impact on consumer price changes in February the statistics office said.
Latvia's Economy Enters Recession in Q4 2007
Well the great Baltic economy overheating debate is now gradually drawing to a close as it becomes increasingly clear in each of the three cases (Latvia, Lithuania and Estonia) which way the cookie is eventually going to crumble. Today it is Latvia's turn as we now have a more complete set of data on Q4 2007 Latvia GDP from Latvijas Statistika (following the preliminary release covered here), and the most important detail is that they have revised their year-on-year growth estimate down to 8%. Unfortunately in the actual release the statistical office don't enter into any detail about the quarter itself, and in particular don't give a number for quarter on quarter growth. So, since the number looked very small and I was curious to know what the actualy quarterly performance was I went and checked in the database, and here is a summary of what I found.
Basically if you look at the last two bars on the above chart you should be able to just make out that - at constant prices - Latvian GDP actually declined between Q3 and Q4 2007, down to 2.222 billion Lat from 2.227 billion lat in Q3 2007. That is a DROP of 0.23% (my own calculations) which might seem small but we should bear in mind that in Q3 the Latvian economy was still growing at a quartery rate of 2.8% (or around 11% annualised) so movin from this to an annualised negative growth rate of around 1% is not at all small beer, and constitutes very rapid deceleration indeed. So while the actually data point may not seem like much, the implications are really quite profound. Technically we could consider a recession as two quarters (back to back) of negative growth. Well, we just had one of them it seems, and with all the dials continuing to show negative we are surely now in the third month of the second one. Which means, on my call, that Latvia is fully in recession at this point, and the only question really left is how long and how deep the recession is going to be.
Of course you can get some idea of the speed of the slowdown from looking at the year on year growth chart, but this doesn't really give us enough detail at this particular point in time to get hold of the actual process taking place.
To answer one small potential quibble in advance, the Latvian Statistics Office do not seem to publish seasonally adjusted quarterly data, so I am working from original series numbers (corrected for constant prices). However, if we look at the chart for GDP on a quarterly basis since 2000, we can see that the seasonal variance is not that large, at least between Q3 and Q4 it isn't, and in no previous Q4 so far this century has GDP actually fallen, and if there has been any notable seasonal impact it is in a slight slowing in Q1, when bad weather will presumeably have affected construction activity, agriculture and transport, and retail sales may be slow in the post xmas period. The current slowdown in construction has little to do with seasonal factors, and everything to do with the cutting off of the credit supply by the Scandinavian banks back in the late spring.
Moving on to look now at the Q4 "uses of GDP" side, the only area which showed positive movement was in fact the much berated area of government spending, which I think basically vindicates both me and the Latvian government for saying that during the last quarter of 2007 it was ridiculous to continue talking about trying to run a fiscal surplus since the economy had already turned (six months earlier, and then previous to that was a very different matter). If we start by looking in detail at private consumption for Q4 we will find that this was down from 1.637 billion Lats in Q3 to 1.612 billion in Q4 (or by -1.55%).
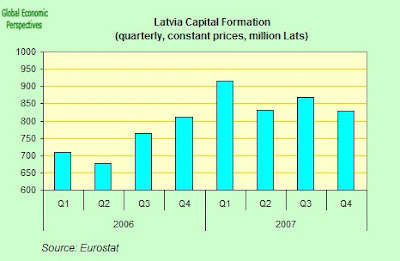
On the other hand gross capital formation was down from 920 million Lat in Q3 to 873,2 million in Q4 (a reduction of 4.69% - all numbers at constant prices).
External trade was also less of a drag in Q4, although the deficit was still substantial, dropping from 582.5 million Lat in Q3 to 561.4 million in Q4 (a reduction of 3.6%) .
So Latvian growth will have got a little extra uplift from the steadily improving export position. We simply have to hope that this can hold up in the coming future.
As I say the only really strong point in all of this was government consumption, which increased from 303.5 million Lat in 343.3 million Lat in Q4 (or up by a hefty 13.1%). Since the Latvian economy now needs a very heavy and rapid blood transfusion if it is not to swoon completely, more power to the elbow of government spending in the short term should be the watchword from where I am sitting. The economy now urgently needs some sort of platform placing firmly underneath it, since otherwise with this rate of contraction the danger is that as the inflation peters out it will be followed by sharp and severe deflation.
So as a say at the start of this post, the great "hard landing - soft landing" debate is now effectively over, and a hard landing it is (although I haven't seen the touch judge raising his red flag yet). The only real outstanding issues now are how long the Lat peg can hold, and what to do now to drag the economy out of the mire into which it is steadily sinking.
Thursday, March 6, 2008
Latvia Industrial Output January 2008
According to the latest data from Latvijas Statistika, when compared to December 2007 industrial production in January was up slightly. On a constant prices (considering the influence of the price changes in the reference period) and seasonally adjusted basis (considering the influence of the season and number of working days) it increased by 2%. Of this the increase in mining and quarrying activity was 8.3% (4.2% according to seasonally adjusted data), electricity, gas and water supply 7.8% (3.4% according to seasonally adjusted data), while manufacturing decreased of 8.8% (increasing 1.5% month on month according to seasonally adjusted data).
OK, so much for the rigmorole, now what does all this mean? Well it means that in January and over the longer haul things were still getting worse, but that they were getting worse at a slighly slower rate than in December. If we look at the all-industry chart, we will see that the annual rate of decline was not only reduced in January, but annual break even point was almost reached with only a very slight reduction in output (-0.1%) taking place. But since the volatility (the ups and downs) in the data is so pronounced I think it would be foolhardy to try and read anything very much into any of this at this point.
If we look at the year on year chart for manufacturing only, then again the annual rate of deceleration in manufacturing decreased. Of course this is basically good news, but we need to see first whether this is sustained or just a blip.
Perhaps the most revealing chart if the one for the all industry index itself. What we can see here is that December 2007 was a very bad month, while December 2006 was a very good one. So last months year on year number was unflatteringly low, and some bounce back was to be expected. Bottom line: we are still effectively contracting.
Latvia Retail Sales January 2008
According to the latest data from Latvijas Statistika retail sales in January - when compared to December 2007 on a seasonally adjusted basis - decreased by 1.5%. And in January 2008 when compared to January 2007 sales decreased by 0.7% (data adjusted by number of working days). That is we are also into negative territory on a year on year basis.
Month on month turnover in retail trade enterprises selling textiles, wearing apparel and footwear decreased by 13.7% and in specialised stores selling mainly food, beverages and tobacco by 12.6%. Turnover in retail trade enterprises selling pharmaceutical and medical goods, cosmetics and toiletry increased by 2.5% month on month, while non-specialised stores, selling mainly non-food increased by 22.1% and stores selling furniture, household goods, electrical appliances and construction materials saw their sales rise by by 2.9%.
On another front I mentioned in this post about retail sales in Estonia that I didn't really see any major time lag between economic events in the two countries looking at the retail sales chart. Latvian Abroad chimed in with the following:
Well this is an interesting point about wages that I hadn't really thought about. Basically I've been looking at year on year wage increase charts, but basically not coming from the region I'd missed something so obvious as the relative differences in wages between the countries. So I went and checked out the data a bit.
First of all the comparative wage indices for the two countries.
Well, so far so good I thought. All the way back to 1996 the two countries seem to track each other pretty closely, indeed with the last litle extra sprint arguably Latvia has more or less positioned itself vis a vis Estonia in the position it was back in 1996. But of course none of this tells us about the RELATIVE wages (as opposed to the relative movements in wages) between the two countries, and this was Latvian Abroad's point I think.
So then I checked out the data for average monthly and average hourly wage costs.
So there I think you can see it, Latvian Abroad is right, there is a significant difference in the wage levels between the two countries, although I wouldn't be tempted to move beyond this and make any more general comparison here (like Estonians are better paid than Latvians, although they may well be), since it all depends on the levels of productivity involved and the value content of the work people are doing. But the difference is striking and interesting, although going back to the wage index chart I can't see any real evidence of these proportions changing in any systematic way. Neck and necking it I would say, and when we start to look at the inflation side what we have to say is that what is going to matter is just how much all these wages will actually be worth - in either case - when the current "doin is done".
On the other hand Latvian Abroad's point about how it is that Latvia is still at this point able to increase exports to some extent while Estonia seems to have entered decline may well be an interesting and valid one.
Month on month turnover in retail trade enterprises selling textiles, wearing apparel and footwear decreased by 13.7% and in specialised stores selling mainly food, beverages and tobacco by 12.6%. Turnover in retail trade enterprises selling pharmaceutical and medical goods, cosmetics and toiletry increased by 2.5% month on month, while non-specialised stores, selling mainly non-food increased by 22.1% and stores selling furniture, household goods, electrical appliances and construction materials saw their sales rise by by 2.9%.
On another front I mentioned in this post about retail sales in Estonia that I didn't really see any major time lag between economic events in the two countries looking at the retail sales chart. Latvian Abroad chimed in with the following:
I think 2) (the one year time difference) used to be true - until the present credit crunch which was simultaneous. Construction boom took off 1-2 years later in Latvia (compared to Estonia) and so on.
Now, the events are mostly simultaneous. One exception is that Estonian exports are already declining year-on-year (loss of competitiveness?) while Latvian ones are still growing. Latvian salaries are 20-30% below Estonian which is around 1 year at the present salary increase rates - that could explain it.
Well this is an interesting point about wages that I hadn't really thought about. Basically I've been looking at year on year wage increase charts, but basically not coming from the region I'd missed something so obvious as the relative differences in wages between the countries. So I went and checked out the data a bit.
First of all the comparative wage indices for the two countries.
Well, so far so good I thought. All the way back to 1996 the two countries seem to track each other pretty closely, indeed with the last litle extra sprint arguably Latvia has more or less positioned itself vis a vis Estonia in the position it was back in 1996. But of course none of this tells us about the RELATIVE wages (as opposed to the relative movements in wages) between the two countries, and this was Latvian Abroad's point I think.
So then I checked out the data for average monthly and average hourly wage costs.
So there I think you can see it, Latvian Abroad is right, there is a significant difference in the wage levels between the two countries, although I wouldn't be tempted to move beyond this and make any more general comparison here (like Estonians are better paid than Latvians, although they may well be), since it all depends on the levels of productivity involved and the value content of the work people are doing. But the difference is striking and interesting, although going back to the wage index chart I can't see any real evidence of these proportions changing in any systematic way. Neck and necking it I would say, and when we start to look at the inflation side what we have to say is that what is going to matter is just how much all these wages will actually be worth - in either case - when the current "doin is done".
On the other hand Latvian Abroad's point about how it is that Latvia is still at this point able to increase exports to some extent while Estonia seems to have entered decline may well be an interesting and valid one.
Subscribe to:
Posts (Atom)